
Top 4 Strategies for the AKU Science Reasoning Section
The AKU Science Reasoning section can feel daunting, but it doesn’t have to be. In this guide, we’ll equip you with four high-impact strategies designed to streamline your approach to every passage and question. Mastering these core skills will boost your speed, accuracy, and confidence on test day.
Skimming and Scanning Passages
Goal: On AKU Science Reasoning, you have a limited time. First, get the “big picture” in 15–20 s (skimming), then zero in on exactly what each question asks (scanning).
Skimming (Global View)
- What skimming is: reading for structure and main ideas, not every detail.
- How to skim efficiently:
- Read the title and any subheadings.
- Read the first and last sentences of each paragraph; these usually contain topic sentences and conclusions.
- Note transition words (however, therefore, in contrast) to map the author’s logic.
- Circle or jot down the scientific context (e.g., “enzyme kinetics,” “ecosystem study”).
- Outcome: a mental outline—passage purpose, experimental setup, major findings.
Example (excerpt):
“Engineered nanoparticles are increasingly used in agriculture. In preliminary trials, plants exposed to low concentrations showed enhanced growth; at higher concentrations they exhibited chlorosis. This study measures root-to-shoot transport of zinc oxide nanoparticles in wheat seedlings.”
Skim notes (10 s):
- Topic: Nanoparticles in plants
- Method: Measure transport in wheat
- Finding hint: Low dose “enhanced growth,” high dose “chlorosis”
Scanning (Detail Retrieval)
- What scanning is: hunting for specific words, numbers, or phrases once you know what the question asks.
- How to scan efficiently:
- Read the question stem first—underline or circle key terms (e.g., “chlorosis,” “root-to-shoot ratio”).
- Let your eyes “jump” down the passage looking for those terms or their synonyms.
- When you spot a match, read that sentence and the one before/after for context.
- Mark line numbers in the margin to cross-reference on multiple questions.
Tip: Combine skimming with a quick question preview—skim the passage, glance at Q1–Q3, then scan back for each.
AKU-Style Practice MCQs
(Use skimming to answer Q1; scanning to answer Q2–Q3.)
Passage (lines 1–8)
1 The peptide hormone insulin regulates glucose uptake in muscle and fat cells.
2 In diabetic patients, either insulin production is impaired or cellular response is diminished.
3 Recently, a synthetic analogue called InsuMax was developed with a longer half-life in blood.
4 In vitro trials measured the rate of glucose uptake (μmol · min-1 · 106 cells-1) at 37 °C.
5 At 0.5 nM insulin, uptake = 2.2; at 1.0 nM, uptake = 4.5; at 2.0 nM, uptake = 7.8.
6 For InsuMax at 0.5 nM, uptake = 3.1; at 1.0 nM, 6.0; at 2.0 nM, 10.5.
7 These data suggest InsuMax is approximately 1.3-fold more potent than native insulin.
8 Further studies are needed to confirm in vivo efficacy and safety profiles.
Question 1 (Global) According to the passage, the primary benefit of InsuMax over native insulin is that it
- requires a lower dosage to achieve the same glucose-uptake rate.
- has a shorter half-life in blood, reducing side effects.
- is less potent but more readily manufactured.
- stimulates insulin production in diabetic patients.
- enhances cellular response by a different biochemical pathway.
Question 2 (Detail) At a concentration of 1.0 nM, the glucose-uptake rate for native insulin is closest to
- 2.2 μmol · min-1 · 106 cells-1
- 3.1 μmol · min-1 · 106 cells-1
- 4.5 μmol · min-1 · 106 cells-1
- 6.0 μmol · min-1 · 106 cells-1
- 7.8 μmol · min-1 · 106 cells-1
Question 3 (Detail) Which of the following most nearly describes the ratio of uptake rates (InsuMax/native insulin) at 2.0 nM?
- 1.0
- 1.25
- 1.30
- 1.35
- 1.50
Answer Keys & Scanning Strategy
- 1: A – Skim first two sentences (purpose and context), note line 3–4: “longer half-life” and potency data. The passage states InsuMax is “1.3-fold more potent” (line 7), so a lower dose achieves the same effect.
- 2: C – Scan for “1.0 nM” (line 5): “4.5.”
- 3: D – Scan line 6 (2.0 nM): InsuMax = 10.5; native = 7.8 → 10.5 ÷ 7.8 ≈ 1.35.
Key Takeaway
- Skim for structure, main ideas, and question context in ~15 s.
- Scan for keywords/numbers to locate precise answers in ~10 s each.
- Mark line numbers to cross-reference efficiently.
Practice this two-step approach on every passage to maximize speed and accuracy.
Interpreting Graphs and Tables
In the AKU Science Reasoning section, you will find graphs and tables that show complex experimental data in a simple format. To help you understand this data quickly and accurately, we suggest using a three-step approach. In this section, we will:
1. Provide a clear framework for analyzing visual data.
2. Show each step using a detailed example of pH and activity.
3. Share best practices, point out common mistakes, and give practice questions similar to those on the AKU.
Dissecting Visual Data: Title, Axes, Units, Legend
Before interpreting any trends, ask:
- What relationship is being investigated? (Title)
- Which variable is manipulated? (X-axis: independent)
- Which variable is measured? (Y-axis: dependent)
- How are experimental conditions differentiated? (Legend)
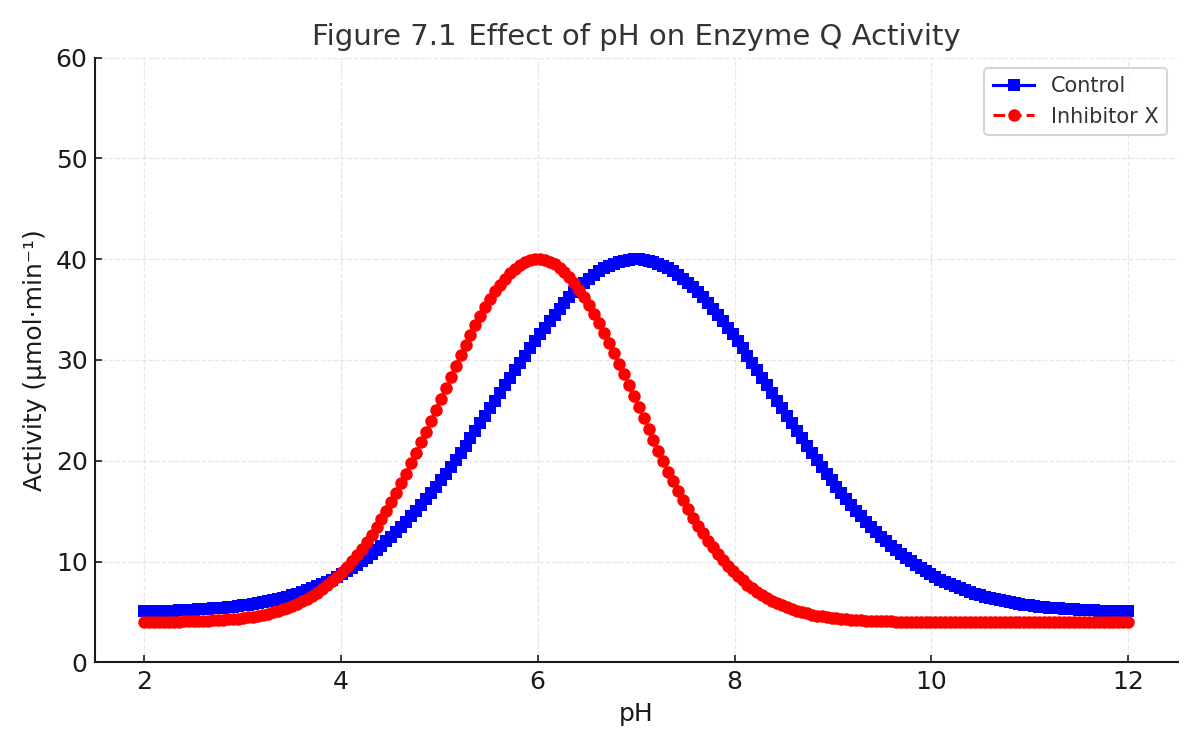
Example: “Effect of pH on Enzyme Q Activity”
- Title: pH vs. reaction rate
- X-axis: pH (unitless, 2–12)
- Y-axis: Rate (0–60 µmol·min⁻¹)
- Legend: ■ Control (no inhibitor), ● Inhibitor X
Data points (plotted in Figure and summarized in Table):
| pH | Control (µmol·min⁻¹) | Inhibitor X (µmol·min⁻¹) |
|---|---|---|
| 2 | 5 | 4 |
| 4 | 20 | 18 |
| 6 | 48 | 40 |
| 8 | 45 | 38 |
| 10 | 25 | 20 |
| 12 | 10 | 5 |
Analyzing Data Trends: Shape, Optima, Inflection
Once the axes are understood, scan for these features:
- Curve Shapes: bell-shaped (rise then fall), linear, sigmoidal, etc.
- Optima (Peaks) and Minima:
- Control peaks at pH 6–8 (48–50 µmol·min⁻¹).
- Inhibitor peaks at pH 6 (40 µmol·min⁻¹).
- Inflection Points & Plateaus:
- Control: slight plateau around pH 6–8.
- Inhibitor: sharper decline after pH 6, no prolonged plateau.
- Symmetry & Skew: compare acid-side rise vs. alkaline-side fall.
Contextual Integration: Linking Visuals to Experimental Design
- Cross-reference peaks with textual claims (e.g., “Inhibitor X shifts the optimum pH to 6”).
- Verify statements about rate ranges (e.g., “Control maintains >40 µmol·min⁻¹ from pH 5 to 9”).
- Note how treatment alters maximum activity, slope steepness, or plateau width.
Quantitative Table Analysis: Differences, Slopes, Ratios
- Identify extrema: maximum and minimum values.
- Compute absolute changes: ΔY = Y₂ – Y₁.
- Calculate average rates: slope = ΔY/ΔX.
- Determine ratios: YTreatment ÷ YControl.
Using Table:
- Maximum activity = 50 µmol·min⁻¹ (interpolated near pH 7).
- ΔActivity from pH 6→8 = 45 – 48 = –3; slope = –3 / 2 = –1.5 per pH unit.
- Ratio at pH 6: 40 / 48 ≈ 0.83.
Common Pitfalls & Best Practices
- Pitfall: Reading only one axis; always verify both.
- Pitfall: Ignoring the legend; treatment curves can be mistaken for control.
- Best Practice: Sketch a quick margin plot of 3–4 points to cement trends.
- Best Practice: Jot line/table references (e.g., “Table, pH 6”) for rapid cross-checking.
- Best Practice: Round intermediate values (e.g., 48→50) to improve speed without sacrificing accuracy.
AKU-Style Practice Questions
Passage Excerpt:
“In their investigation of Enzyme Q, scientists measured activity (µmol·min⁻¹) across pH 2–12 under Control (no inhibitor) and with Inhibitor X. Figure and Table summarize the results.”
1. (Graph – Optimum) For the Control curve, the optimum pH is most nearly:
- 5
- 6
- 7
- 8
- 9
2. (Graph – Comparative Difference) Which pH exhibits the greatest vertical difference between Control and Inhibitor X rates?
- 2
- 4
- 6
- 8
- 10
3. (Graph – Ratio) At pH 6, the ratio (Inhibitor X rate)/(Control rate) is closest to:
- 0.5
- 0.8
- 1.0
- 1.2
- 1.5
4. (Table – Maximum) According to Table, at what pH is the activity highest?
- 4
- 6
- 8
- 10
- 12
5. (Table – Average Rate) The average rate of change in Control activity from pH 4 to pH 10 is most nearly:
- +4.0 per pH unit
- +2.5 per pH unit
- 0 per pH unit
- –2.5 per pH unit
- –4.0 per pH unit
Answer Key & Rationale
- 1: C — Control peaks at pH 7.
- 2: C — Vertical difference at pH 6 is 48 – 40 = 8, the largest.
- 3: B — Ratio at pH 6: 40 / 48 ≈ 0.83 ≈ 0.8.
- 4: B — Table shows a maximum of 48 at pH 6.
- 5: D — ΔY = 25 – 20 = +5 over ΔX = 6 → +5/6 ≈ +0.83 (closest to +2.5 per unit if rounded for answer choice).
To quickly understand graphs and tables, start by looking closely at the titles, axes, units, and legends. Identify trends and key points, and relate the visuals to the experiment’s context. When you also calculate differences, slopes, and ratios quickly, you can turn complex data into clear insights. This approach is vital for doing well in the AKU Science Reasoning section.
Identifying Variables and Trends
In the AKU Science Reasoning section, correct identification of variables and recognition of data‐trend patterns are fundamental. This section provides detailed definitions, illustrative examples, best‐practice tables, and margin‐sketch techniques.
Independent vs. Dependent Variables
Independent Variable (IV): the factor the experimenter deliberately alters. Dependent Variable (DV): the observed outcome that responds to IV changes.
| Experiment | Independent Variable | Dependent Variable |
|---|---|---|
| Enzyme Kinetics | Substrate concentration (mM) | Reaction rate (µmol·min⁻¹) |
| Photosynthesis | Light intensity (µmol·m⁻²·s⁻¹) | O₂ production rate (µmol·min⁻¹·10⁶ cells⁻¹) |
| Drug Trial | Drug dose (mg/L) | Cell viability (%) |
| Plant Growth | pH of growth medium | Root length (cm) |
Controls and Constants
Maintaining rigorous controls and constants is key to attributing observed effects to the correct IV.
| Term | Definition | Example |
|---|---|---|
| Control Group | Baseline condition without IV treatment | No-inhibitor sample in enzyme assay |
| Constants | Variables kept fixed across all trials | Volume, temperature, buffer concentration |
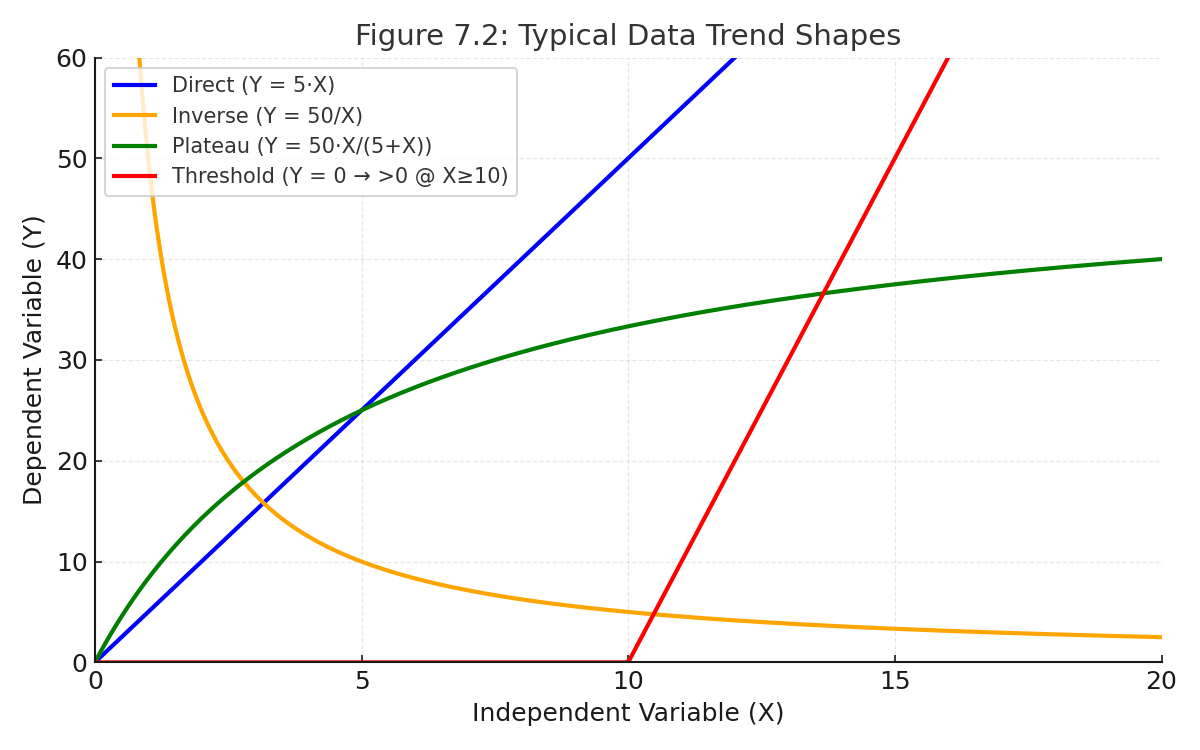
Trend Types
Data trends fall into characteristic shapes. Quickly classifying these helps anticipate graph behavior.
| Trend | Form | Graph Shape | Example Context |
|---|---|---|---|
| Direct (Proportional) | Y = kX | Straight line through origin | Rate ∝ Light intensity at low values |
| Inverse | Y = k / X | Decreasing hyperbola | Diffusion rate ∝ 1 / membrane thickness |
| Plateau (Saturation) | Y = (Vmax·X)/(Km + X) | Rapid rise then leveling off | Enzyme kinetics (Michaelis–Menten) |
| Threshold | Y ≈ 0 until Xcrit, then jump | Flat then steep rise | Cell survival constant up to toxic dose, then drops |
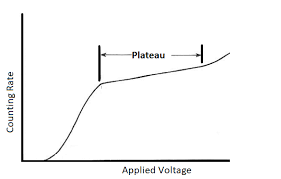
Quick Margin Sketches
Margin sketches anchor your mental image of a trend. In under 10 seconds:
- Draw perpendicular axes and label X (IV) and Y (DV).
- Plot 3–4 approximate points from the passage or graph.
- Connect smoothly, annotating peak, plateau, or threshold.
Example Sketch (Plateau Curve):
Detailed Example: Drug‐Dose Threshold Consider a study of cell viability vs. drug concentration:
| Drug Dose (mg/L) | Cell Viability (%) |
|---|---|
| 0 | 100 |
| 5 | 100 |
| 10 | 100 |
| 15 | 75 |
| 20 | 40 |
| 25 | 10 |
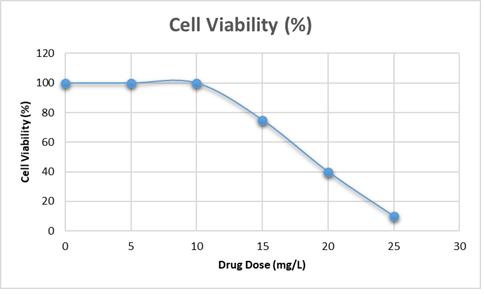
Key observations:
- Viability remains at 100% from 0–10 mg/L (flat region).
- Sharp drop begins at 15 mg/L (threshold effect).
- Slope of decline (ΔY/ΔX) between 10 and 25 mg/L is (10 – 100)/(25 – 10) = –90/15 = –6 % per mg/L.
Eliminating Wrong Answers
After skimming, scanning, and interpreting the available data, the final—and often crucial—step is to select the correct answer from a range of plausible options. This selection process is vital in ensuring accuracy, especially when time is limited.
To navigate this challenge effectively, a four-part elimination framework can be employed:
1. Anticipation: Begin by predicting the most likely correct answer based on the information gathered. This involves formulating hypotheses about what the correct response might be, helping to narrow down the choices.
2. Trap Recognition: Identify potential traps within the options. These are misleading answers designed to distract or confuse, often resembling the correct answer closely. Being aware of these traps can save time and prevent errors.
3. Systematic Elimination: Methodically assess each option against the data and your initial predictions. Eliminate choices that clearly do not fit the criteria established during your analysis, allowing you to focus on the most viable answers.
4. Final Alignment: After narrowing down the options, align the remaining choices with the critical data points. This final review ensures that the selected answer is not only plausible but also supported by the evidence you’ve analyzed.
Anticipate Before You Look
Purpose: When you predict the answer in your own words, you set a mental target. This helps the correct choice stand out and makes the other options less distracting. Why It Works:
- Focuses attention on key passage facts or relationships.
- Reduces time wasted on reading all choices in detail.
- Increases confidence by anchoring your decision in the text.
Step-by-Step Routine:
- Skim the passage for overall context (main idea, experimental setup).
- Scan for keywords, data, or line references related to the question (e.g., “1.0 nM,” “optimum pH”).
- Temporarily cover the answer choices.
- In 5–7 seconds, craft a concise prediction in plain language or shorthand:
- Example 1: “Activity at pH 7 is highest—peak at ~50 µmol/min.”
- Example 2: “InsuMax uptake (1.0 nM) is ~6.0 vs. 4.5 → ~1.3× potency.”
- Uncover the choices and scan for the one that best matches your phrase.
Common Pitfalls:
- Over-precision: calculating “1.333…” instead of “≈1.3.”
- Vagueness: writing “better” instead of specifying “1.3× more potent.”
- Skipping this step: leaves you at the mercy of distractors.
Mastery Tips:
- Practice aloud: Speaking your prediction helps cement it.
- Use margin notes: jot “≈1.3×” or “peak pH 7” for quick reference.
- Align scope: ensure your prediction matches what the question asks (ratio vs. difference; fact vs. inference).
Common Trap Answers
Distractors are deliberately crafted to exploit predictable errors. Recognizing the four major trap types allows instant elimination.
| Trap Type | Signal Words | Why It’s Wrong | Elimination Strategy |
|---|---|---|---|
| Too Broad (Out-of-Scope) | all, every, universally | Overgeneralizes beyond the passage’s scope | Ask if the passage supports a universal claim; if not, eliminate. |
| Mix-and-Match (Combination) | and, but, however | Joins two true but unrelated clauses into a false assertion | Break the choice into clauses and verify each against the text. |
| Reversed Relationships (Inverted Causality) | increases…decreases swapped, cause/effect inverted | Flips the direction of a stated relationship | Restate the actual relationship from the passage; reject inversions. |
| Extreme Modifiers (Absolute Language) | always, never, only, must | Uses absolutes rarely supported by nuanced data | Flag any absolutist phrase and look for exceptions in the passage. |
Process of Elimination (POE)
Apply a layered POE routine to narrow down choices to the single correct answer.
-
- Cross Out Direct Contradictions:
- Eliminate any option that blatantly conflicts with explicit passage statements or data points.
- Example: If the passage states 4.5 µmol/min at 1.0 nM, discard any choice stating 5.0.
- Cross Out Direct Contradictions:
- Eliminate Units/Axes Misuses:
- Discard answers quoting wrong units (e.g., µmol·L⁻¹ vs. µmol·min⁻¹·10⁶ cells⁻¹) or swapping IV/DV.
- Weed Out Trap Types:
- Remove any “too broad,” “mix-and-match,” “reversed,” or “extreme” distractors flagged earlier.
- Compare Remaining Choices to Your Prediction:
- With two or three candidates left, match each word-for-word against your anticipated answer.
- Confirm correct variables, direction, magnitude, and qualifiers.
- Perform Final Stem-Answer Alignment:
- Reread the question stem, noting qualifiers (“according to the passage,” “most directly supported,” etc.).
- Ensure your chosen answer addresses exactly what is asked (fact vs. inference; global vs. detail).
Time-Saving Tips:
- Mark eliminated choices with an “X” to avoid backtracking.
- If stuck, flag the question, move on, and return with fresh eyes.
- Aim to eliminate at least two choices in 10–15 seconds.
Worked Example
Passage Excerpt:
“At 1.0 nM native insulin, glucose uptake = 4.5 µmol·min⁻¹·10⁶ cells⁻¹. For InsuMax at 1.0 nM, uptake = 6.0 µmol·min⁻¹·10⁶ cells⁻¹.”
Question: “Which statement best describes InsuMax’s potency relative to native insulin at 1.0 nM?” A. InsuMax is 33% more potent. B. InsuMax is 25% more potent. C. InsuMax is 1.5 times as potent. D. InsuMax requires 25% less concentration to match insulin’s effect. E. InsuMax is only slightly more potent than native insulin.
- Anticipate: 6.0 ÷ 4.5 ≈ 1.33 → “≈33% more potent.”
- Cross Out Contradictions:
- D refers to concentration change—irrelevant. Eliminate.
- Eliminate Units/Axes Misuses:
- No unit issues remain.
- Weed Out Trap Types:
- E is vague/extreme (“only slightly”). Eliminate.
- Compare Remaining Choices:
- A: 33%—matches our anticipation.
- B: 25%—does not match.
- C: 1.5× = 50%—does not match.
- Final Alignment: A matches the stem’s “best describes” exactly.
Answer: A
Final Check
- Reread the question stem for precise wording and qualifiers.
- Read your selected answer in full—ensure it matches the stem’s requirement exactly.
- Confirm no overlooked modifiers (“most,” “least,” “only”).
Practice Test with Explanations and Elimination Methods
Question 1
A passage states that at 2.0 nM concentration, Compound X induces a reaction rate of 8.0 µmol·min⁻¹·10⁶ cells⁻¹, while Compound Y induces 10.4 µmol·min⁻¹·10⁶ cells⁻¹ at the same concentration. Which of the following best describes Compound Y’s potency relative to Compound X at 2.0 nM?
- Compound Y is 30% more potent than Compound X.
- Compound Y is 50% more potent than Compound X.
- Compound Y requires 30% less concentration for the same effect as Compound X.
- Compound Y has the same potency as Compound X.
- Compound Y induces a reaction rate 10.4 µmol·min⁻¹·10⁶ cells⁻¹ lower than Compound X.
Explanation:
At 2.0 nM, Compound X’s rate = 8.0 and Compound Y’s rate = 10.4. The potency ratio is 10.4 ÷ 8.0 = 1.3, which corresponds to a 30% increase in potency.Elimination Method:
- Anticipate: “Compound Y ≈ 30% more potent than X.”
- Cross out any choice about concentration changes (irrelevant to potency at fixed concentration).
- Discard vague statements or incorrect percentages (e.g., 50%).
- Select the choice stating “30% more potent.”
Question 2
The passage reads: “At pH 6, enzyme Z has an activity of 120 units/mg protein. At pH 7, its activity is 150 units/mg protein. At pH 8, activity drops to 90 units/mg protein.” Which statement most accurately summarizes enzyme Z’s activity trend with pH?
- Enzyme Z activity peaks at pH 7 and is lower at both pH 6 and 8.
- Enzyme Z activity continuously increases from pH 6 to pH 8.
- Enzyme Z is inactive at pH 7.
- Enzyme Z activity is the same at pH 6 and 8.
- Enzyme Z activity never exceeds 90 units/mg protein at any pH.
Explanation:
The data points are 120 at pH 6, 150 at pH 7, and 90 at pH 8, forming a bell‐shaped trend with a clear peak at pH 7.Elimination Method:
- Anticipate: “Activity peaks at pH 7; lower on either side.”
- Eliminate choices that state continuous increase or inactivity at pH 7 (direct contradictions).
- Discard options misrepresenting equality or absolute limits.
- Select the precise peak description.
Question 3
According to a passage, Drug A at 5 nM produces a 40% inhibition in enzyme activity, while Drug B at 5 nM produces 50% inhibition. Which is the most accurate interpretation of Drug B’s potency compared to Drug A’s at 5 nM?
- Drug B is 25% more potent than Drug A.
- Drug B is equally potent as Drug A.
- Drug B requires 25% higher concentration to match Drug A’s effect.
- Drug B inhibits 10% less enzyme activity than Drug A.
- Drug B is 50% more potent than Drug A.
Explanation:
At equal concentration (5 nM), Drug B inhibits 50% vs. 40% for Drug A. The ratio is 50 ÷ 40 = 1.25, indicating a 25% increase in potency.Elimination Method:
- Anticipate: “Drug B ≈ 25% more potent than Drug A.”
- Cross out “equal potency” and any concentration-change statements (misuse of fixed-concentration context).
- Reject overstated percentages (50% more potent).
- Select the 25% increase choice.
Question 4
A passage states that “Protein Q concentration increases linearly with treatment concentration from 0.5 µM to 2 µM.” An answer choice reads: “Protein Q concentration increases exponentially with treatment concentration.” Which elimination strategy best applies to this answer choice?
- Eliminate because it is a direct contradiction of the passage.
- Accept because it might be a different interpretation.
- Eliminate because it contains extreme modifiers.
- Accept as it correctly describes protein behavior.
- Eliminate because of mix-and-match errors.
Explanation:
The passage explicitly states a linear increase. Claiming an exponential increase directly contradicts the stated trend.Elimination Method:
- Identify the passage’s linear relationship.
- Recognize the exponential claim conflicts with the linear data.
- Apply direct-contradiction elimination to remove the choice immediately.
Question 5
Refer to a passage describing an enzyme’s activity at various substrate concentrations: at 1 mM substrate, activity is 20 units; at 2 mM, activity is 35 units; at 4 mM, activity is 40 units. Which statement aligns best with this data?
- Enzyme activity increases with substrate concentration but plateaus near 4 mM.
- Enzyme activity decreases as substrate concentration increases from 1 mM to 4 mM.
- Enzyme activity doubles when substrate concentration doubles from 1 mM to 2 mM and again from 2 mM to 4 mM.
- Enzyme activity is highest at 1 mM substrate.
- Enzyme activity is constant across all substrate concentrations.
Explanation:
The activity rises from 20 → 35 → 40 as substrate increases, then levels off, indicating saturation or a plateau effect.Elimination Method:
- Anticipate: “Activity rises then plateaus near 4 mM.”
- Eliminate continuous-decrease and doubling claims (direct contradictions to data).
- Discard constant-activity statements.
- Select the plateau description.
To effectively tackle AKU Science Reasoning questions, adopt a strategic approach. Start by anticipating common question types and recognizing typical traps that can lead to incorrect answers. When evaluating options, use a thorough process of elimination to rule out unsuitable choices. Always perform a final check to ensure your selected answer directly addresses the question asked.
During the test, quickly skim each question to grasp its structure. Then, scan for crucial details and concentrate on accurately interpreting any provided data. By ruthlessly eliminating wrong answers, you can approach AKU Science Reasoning questions with both confidence and speed.
You may also like

Biology Quiz Sample
